1. Review of Asset Performance in 2023.
As the path curves around the mountain peak, the rivers and mountains bask in the moonlight. Yesterday, we removed our masks to embrace the world; today, conflicts arise, creating a complex and bewildering situation. War or peace, inflation or rate hikes, investing or lying flat, truth and illusion intertwine, marking another year.
In 2023, global political unrest prevails, conflicts in Eurasia persist, and the fires of war reignite in the Middle East;
In 2023, the global economy tends to stabilize, soaring inflation finally sees a decline, and the ongoing interest rate hikes show signs of a turning point;
In 2023, global technology is on the verge, ChatGPT triggers the AI wave, and SpaceX sparks human imagination;
In 2023, global assets experience a mix of joy and sorrow, with Western giants surging ahead while Eastern newcomers pale in comparison;
Looking back at the global capital markets in 2023, some rejoice while others worry. In this year, the Nasdaq's elephant dances, displaying a sense of spring breeze; the Hang Seng Index opens high and closes low, regretting like a dream that has slipped away; global gold boldly faces challenges, singing triumphantly all the way; Eastern real estate ebbs away, helplessly flowing a thousand miles... Sitting alone, reflecting on the past, in December of last year, We also emphasized the investment value of gold for this year in our previous article: Panning for gold: 2023's outlook for major assets
Looking ahead to 2024, the road ahead seems uncertain, with challenges looming large. However, in the face of adversity, there may be new opportunities. Will the U.S. economy achieve a soft landing? Will the Federal Reserve cut interest rates as planned? Can tech giants continue their relentless rally? Will Great China equities finally see a breakthrough? As the clouds part and daylight emerge, let's patiently await the warmth of spring. In 2024, let's gather our strength and be ready for action together!
1. Performance of Major Asset Classes
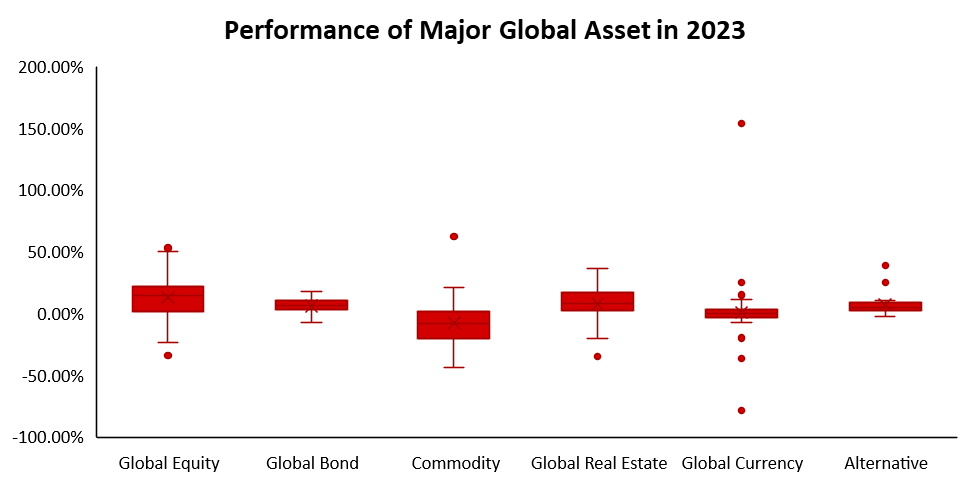
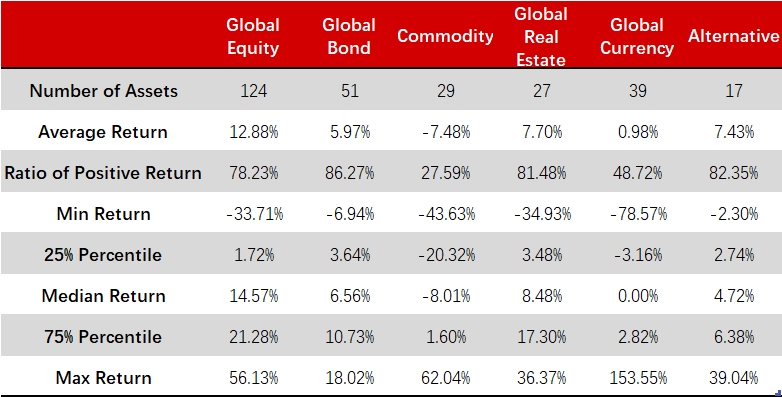
We compiled data on equities, bonds, commodities, real estate, currencies, and alternative investments from 53 countries and regions globally, encompassing a total of six major asset classes and 287 sub-asset categories. To facilitate investor observation and comparison of asset returns across different countries and regions, all return data is denominated in U.S. dollars.
The average return for asset in all categories in 2023 was 7.17%. Among them, 204 assets experienced positive returns, accounting for over 71%. The price trends of most assets have undergone a mean reversion compared to 2022. Specifically:
Global Equities: With 124 types of equity assets, over 78% recorded positive returns this year, averaging an increase of 12.88%. Among them, equity assets in countries such as the United States, Europe, and South America showed significant gains, while equity assets in the Greater China region experienced large declines.
Global Bonds: Featuring 51 types of bond assets, again, over 86% of bond assets enjoyed increases, with an average gain of 5.97%. High-yield bonds in developed countries such as the United States and Europe led the way, while Japanese bonds performed poorly this year.
Commodities: With 29 types of commodities, only about 28% saw increases, with most experiencing declines, averaging a decrease of 7.48%. Cocoa and coffee showed significant gains, while assets like natural gas and crude oil had notable declines.
Global Real Estate: Including 27 types of real estate assets, around 81% of assets recorded increases. The average increase was 7.7%. Real estate in Malaysia and various European countries showed significant gains, while real estate in the Greater China region experienced significant declines.
Global Currencies: Comprising 39 types of currencies, most experienced declines this year with the strong U.S. dollar weakening. Bitcoin soared to new highs, achieving a staggering annual return of 153.55%.
Alternative Investments: Encompassing 17 types of alternative assets, nearly all recorded positive returns. Hedge funds based on fundamental stock picks and the AIEQ artificial intelligence fund led the way, while global macro and managed futures performed moderately.
Data source: Bloomberg, Tiger Brokers
2. The Advancing "Titans": Technology Giants Leading The Way
At the beginning of 2023, the two most prevalent expectations in the market were the "Fed pivot" and the "Chinese recovery," yet the actual trajectory this year turned out to be divergent. On one hand, the robust economic data in the United States prevented the Federal Reserve from quick pivoting; on the other hand, following the easing of the Zero-COVID policy in China, economic activities rebounded rapidly, but the economic recovery for the entire year still fell short of the initial expectations.
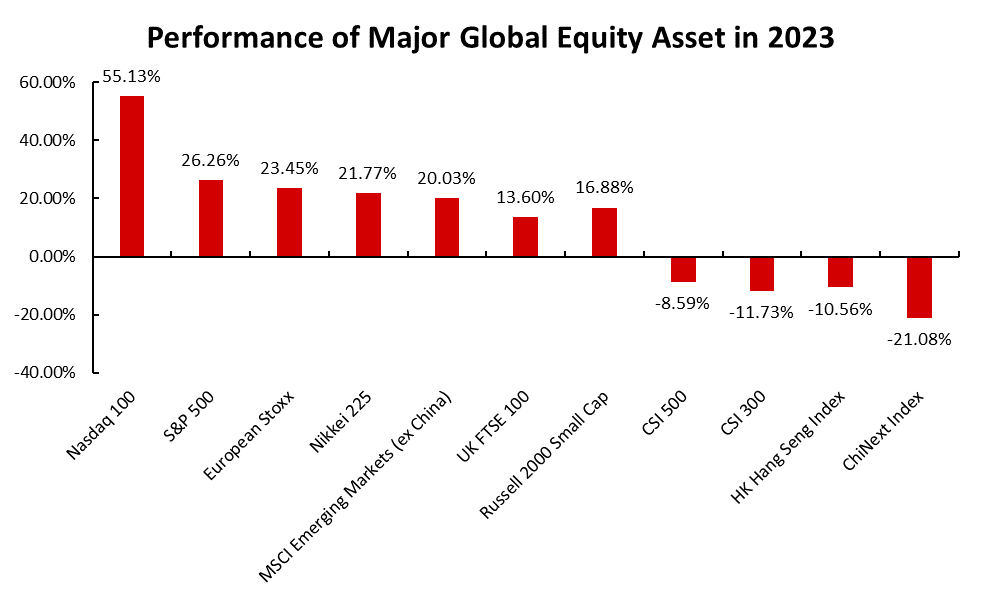
Affected by these two factors, looking across the global stock market in 2023, it can be described as a mix of joy and sorrow. Equitiy markets of U.S., Europe, Japan, and emerging market excluding China all yielded decent returns. The Nasdaq 100 index, in particular, showed a strong upward trend throughout the year, surging over 50%, astonishing global investors. However, in contrast, equity markets in the Greater China region fared relatively poorly. Assets such as the Hang Seng Index, the CSI Shanghai and Shenzhen 300 Index, and the ChiNext Index all experienced significant declines.
Data source: Bloomberg, Tiger Brokers
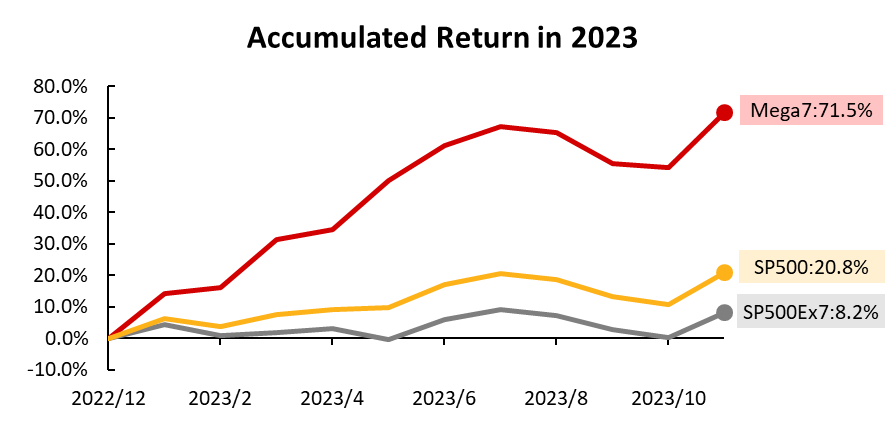
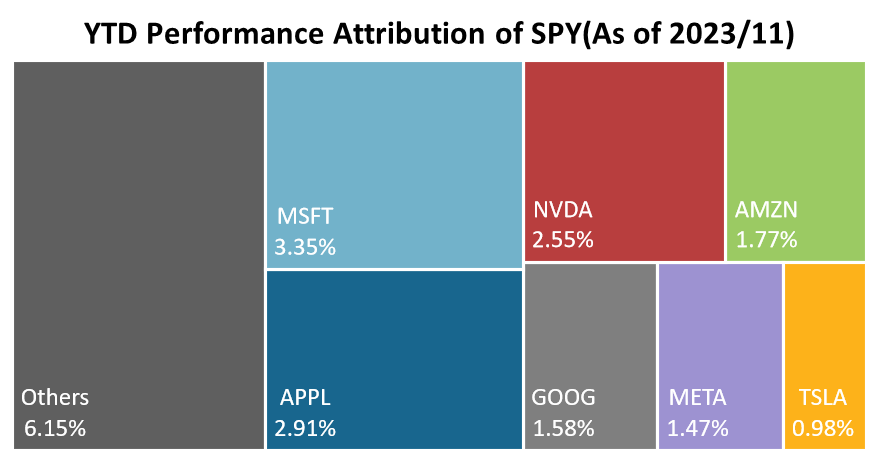
On the other hand, the "iPhone Moment" of ChatGPT this year triggered a new global wave of AI technological revolution, making AI the most explosive growth point in the capital markets. Under this powerful stimulus, NVIDIA's stock price more than tripled for the year, and its market value officially surpassed the trillion-dollar threshold. Moreover, the Mega7, consisting of NVIDIA, Apple, Microsoft, Google, Meta, Tesla, and Amazon, soared to new highs. As of November 30th, the Mega7 portfolio recorded a yearly increase of over 70%, while the combination of the remaining companies in the S&P 500 (SP500Ex) only rose by 8.2%, illustrating a stark contrast between the two. In summary, the phrase "the elephant dances" aptly captures the overall trend of the stock market for the entire year.
Data source: Bloomberg, Tiger Brokers
2. Global Investment Themes For 2024.
Landing vs. Crashing – Can The U.S. Economy Sustain Its Strength?
1.1 Can Fiscal Stimulus Continue To Be Robust?
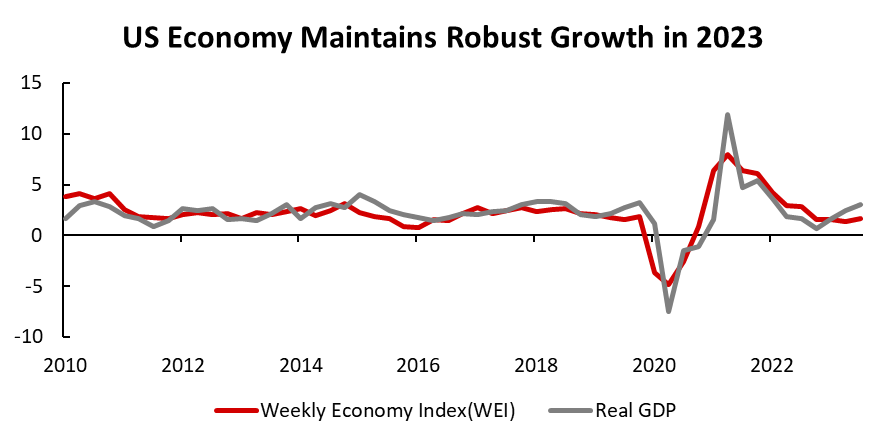
In 2023, the U.S. fiscal policy underwent significant expansion, strongly supporting the reshoring of American manufacturing. This initiative propelled investments and employment in sectors such as construction, semiconductor manufacturing, and transportation, contributing to the revival of both supply-side dynamics and overall demand. Against this backdrop, will the United States maintain the robust intensity of fiscal stimulus in the future?
Data source: Bloomberg, Tiger Brokers
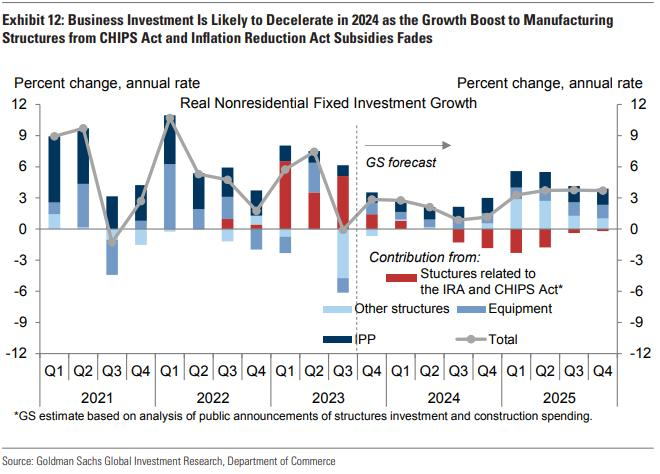
From the perspective of fiscal expenditure, as the United States enters an election year in 2024, mainstream institutions in the market generally predict a potential reduction in overall fiscal stimulus. Major institutions such as U.S. banks anticipate a slight year-on-year decrease in the scale of fiscal spending next year. Goldman Sachs, on the other hand, suggests a reduction in government investments related to the Inflation Reduction Act (IRA) and the CHIPS Act (CHIPs) (highlighted in red in the graph below), but anticipates a continued increase in investments in the field of AI, supporting a moderate overall rise in non-residential investments (highlighted in gray in the graph below).
Data source: Goldman Sachs Global Investment research, Department of Commerce
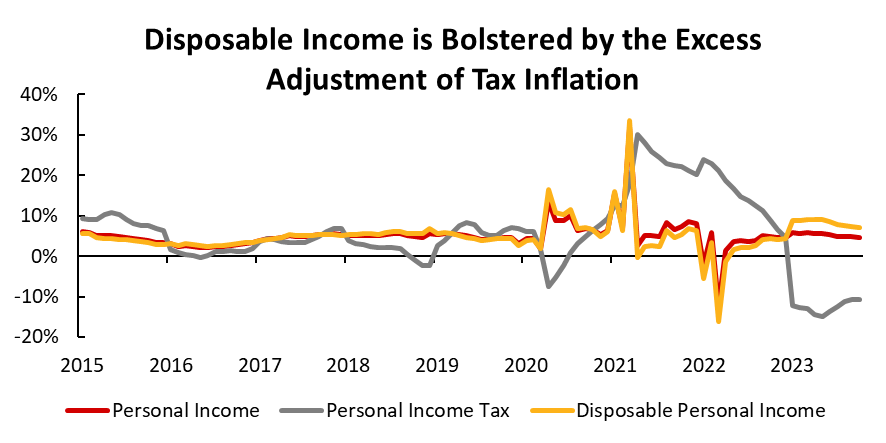
From the perspective of tax concessions, in 2023, due to persistent high inflationary pressures, the U.S. Internal Revenue Service increased the deduction amount for personal income tax by around 7%. However, the actual year-on-year growth in monthly Personal Consumption Expenditures (PCE) for 2023 was only about 4%. Under the impact of this excess adjustment, the year-on-year growth rate of disposable personal income increased by an additional 3%, effectively stimulating the consumption capacity of the residential sector.
Data source: Bloomberg, Tiger Brokers
For 2024, the IRS has increased the deduction amount for personal income tax by 5.4%. Through a comparison with adjustment plans and inflation data over the past five years, the theoretical excess adjustment magnitude for 2024 is the largest. Even if inflation does not continue to decline in 2024, tax concessions will further stimulate the growth of disposable personal income in the residential sector.
Year | 2024 | 2023 | 2022 | 2021 | 2020 |
|---|---|---|---|---|---|
Tax Inflation Adjustment | 5.4% | 7.0% | 3.2% | 1.2% | 1.6% |
(PCE) at the time of the announcement | 3.0% | 6.3% | 6.0% | 1.1% | 1.3% |
The excess adjustment | 2.4% | 0.7% | -2.8% | 0.1% | 0.3% |
Data source: IRS, Tiger Brokers
Overall, considering both fiscal expenditure and tax concessions, the U.S. government may continue to maintain a strong fiscal expansion in 2024, albeit with a slightly reduced stimulus intensity.
1.2 How Long Can Strong Consumer Spending Sustain?
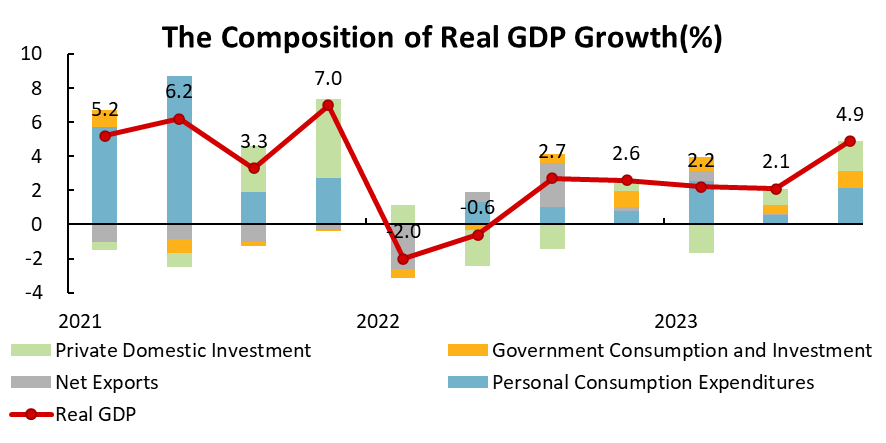
Looking at data from recent years, consumer spending is a crucial component of the U.S. GDP, contributing almost half of in the economic growth of 2023. The real GDP in the United States surged at an annualized rate of 4.9% in the third quarter, with personal consumption expenditures contributing 2.1%. From the perspective of the expenditure approach in GDP accounting, consumption components have consistently driven GDP positively for six consecutive quarters, making them a vital engine for economic growth. However, with the ongoing pressure of high-interest rates, the question arises: can the driving factors behind consumer spending growth remain robust?
Data source: WIND, Tiger Brokers
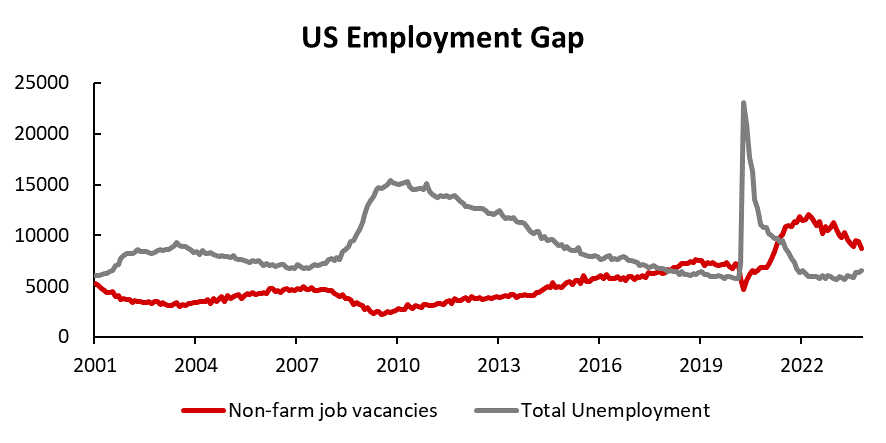
From the overall data perspective, the U.S. labor market is showing a continuous cooling trend. The non-farm job vacancy rate has been on a downward trend for several consecutive months, and the number of unemployed individuals has been gradually increasing. The tight supply and demand situation in the job market that emerged after the pandemic has somewhat eased. However, looking at the bigger picture, the employment gap in the United States remains at a relatively high level, indicating that the U.S. job market is still robust.
Data source: WIND, Tiger Brokers
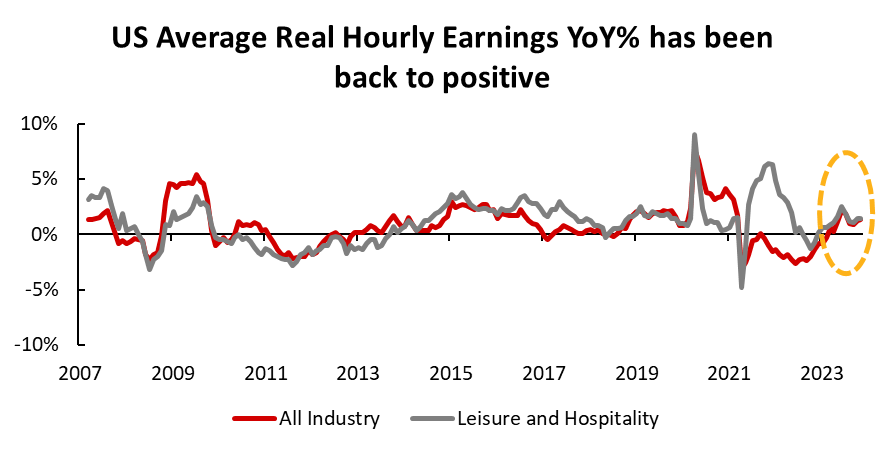
At the same time, U.S. residents have been enjoying nominal wage increases since the pandemic. Although in 2023, the growth rate of nominal hourly wages slowed down, it still outpaced the declining growth rate of inflation, ensuring that real purchasing power remains robust. Especially in the entertainment and restaurant industry, where the average hourly wage is the lowest, the real wage growth rate exceeded the average. Compared to high-income groups, individuals with middle to low incomes have a higher marginal consumption tendency, providing solid support for consumer spending among U.S. residents.
Data source: WIND, Tiger Brokers
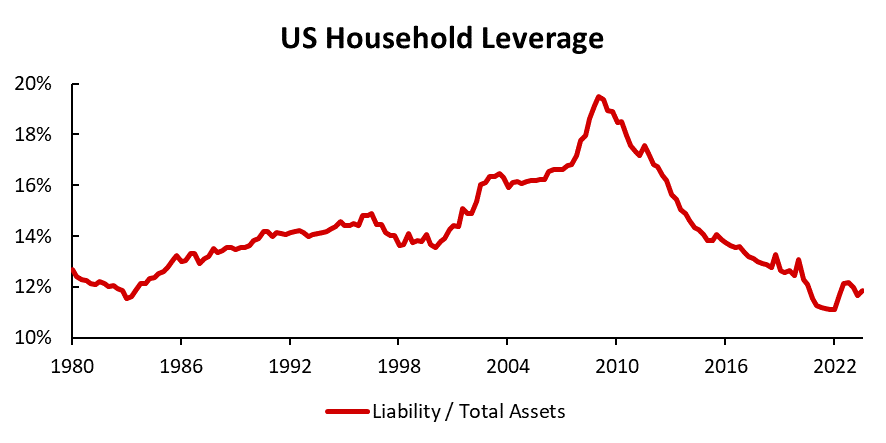
A healthy balance sheet has also laid a strong foundation for consumer spending among U.S. residents. The household sector in the United States underwent a continuous 15-year deleveraging process since the financial crisis in 2008. Currently, the debt-to-assets ratio is at near 40-year lows, indicating a very healthy overall balance sheet. Even though there has been a recent increase in credit card delinquency rates, it has not led to a significant deterioration in the household sector's balance sheet.
Data source: FED, Tiger Brokers
Overall, there is still a significant gap between job vacancies and unemployment figures, and the average real hourly wages for U.S. residents continue to rise. Additionally, household debt levels are below historical averages. Therefore, we expect U.S. consumer spending will remain robust in 2024, providing continued support for economic growth.
1.3 Can Strong Corporate Growth Be Sustained?
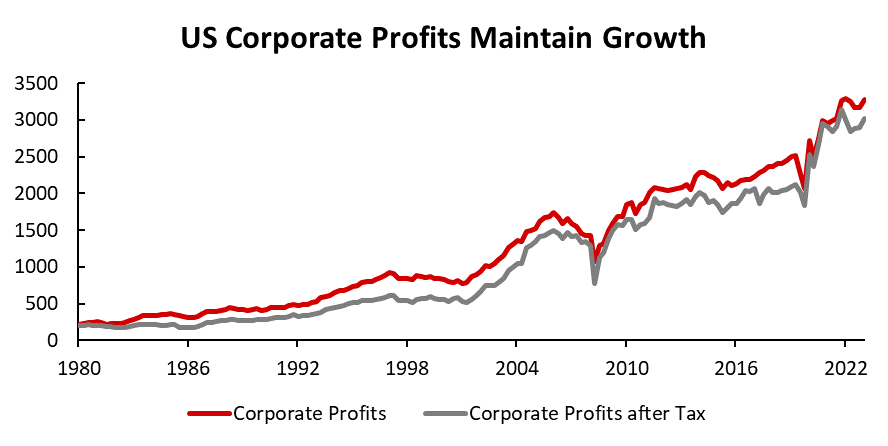
At the beginning of this year, amid unanimous expectations of a market downturn, U.S. corporate profits experienced a certain degree of decline. However, in the following two quarters, companies achieved sustained profit growth in a high-interest-rate environment, with current profits only slightly below the peak levels during the period of significant stimulus in response to the pandemic.
Data source: Bloomberg, Tiger Brokers
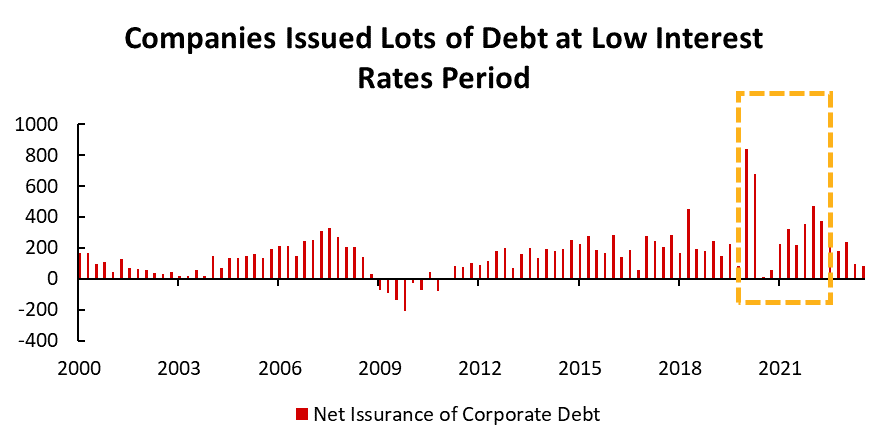
From a data perspective, U.S. businesses have indeed sustained growth in a high-interest-rate environment. However, the impact of high interest rates on businesses actually exhibits a lag effect: U.S. businesses issued a significant amount of debt during the low-interest-rate period around 2020. This supported the cash flow of businesses, substantially reducing their fundraising needs in a high-interest-rate environment, thereby maintaining lower funding costs. This is also why, despite the Federal Reserve's continuous interest rate hikes, interest expenses for the corporate sector have not seen a significant increase.
Data source: FED, Tiger Brokers
However, low-cost funding is not inexhaustible. As future low-interest-rate debts mature, the interest payments for these debts will increase, thereby impacting the operational vitality of businesses. Industries heavily reliant on financing, such as commercial real estate, will face greater challenges. As of December 1, 2023, the credit spread for BBB-rated commercial mortgage-backed securities (CMBS) in the United States has widened to 9.47%, more than 60 basis points higher than the peak during the 2020 COVID-19 crisis.
Nevertheless, according to our analysis, the bulk of the currently outstanding corporate bonds in the United States are set to mature in the years of 2025 to 2026. With about 6.25% of the current outstanding bonds maturing in 2024, corporate interest expenses will probably increase in the next year as existing debts are rolled over, but the overall magnitude of the increase is expected to be relatively moderate.

Data source: Bloomberg, Tiger Brokers
Overall, the U.S. corporate sector is expected to face greater impact from refinancing costs in 2024, with some areas possibly experiencing crises. However, the peak maturity of outstanding corporate bonds is in 2025-2026, and current corporate profits remain high. We believe that the robust growth in the corporate sector will significantly weaken next year but is unlikely to lead to a systemic crisis.
Rate Cuts vs. Rate Hikes, Where Is The Federal Reserve Headed?
In the last FOMC meeting of 2023, the Federal Reserve unexpectedly shifted to a dovish stance:
Chairman Powell, at the beginning of the press conference, stated that “Inflation has eased from its highs”, departing from the usual emphasis on the importance of price stability and the Fed's commitment to fighting inflation.
In the Q&A session, Powell said "the question of when will it become appropriate to begin dailing back the amount of policy restraint in place, that begins to come into view, and is clearly a topic of discussion for us at our meeting today". He also explicitly pointed out that "the reason you wouldn't wait to get to 2 percent to cut rates is that policy would be too late". This is a U-turn from his statement just two weeks ago, where he suggested ”it would be premature to...speculate on when policy might ease."
So, why Chairman Powell made such a dovish pivot? Did he get pressure from the Treasury Department, or did he see a crisis that the market had not noticed? We believe the real reason may lie in the November CPI and PPI data, which was released just before the FOMC meeting, was sufficient to make the Fed believe that November's U.S. PCE inflation, from the Fed's perspective, will fall below 2%!
2.1 Can Inflation Return To The Fed's 2% Target As Desired?
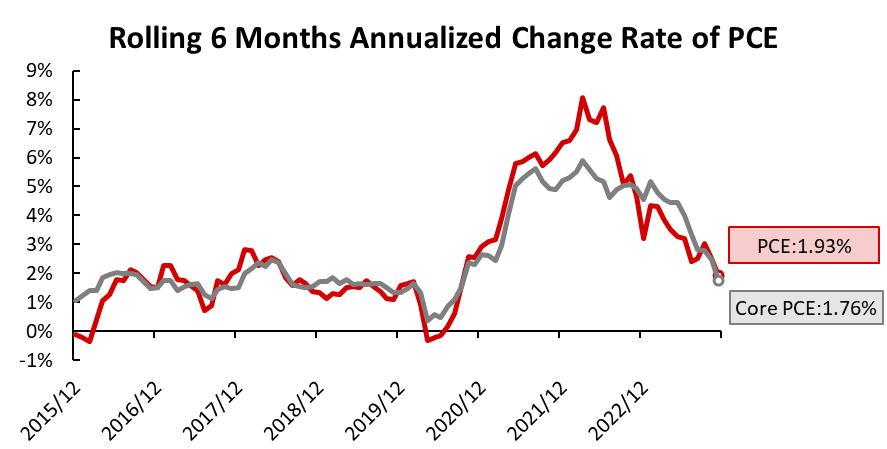
Powell stated in the press conference that based on the latest U.S. CPI report for November, the YOY growth rate of PCE inflation in November will decline to 2.6%, and the core PCE YOY growth rate will fall to 3.1%. At the same time, Powell emphasized, in response to a question from Nick Timiraos, a Wall Street Journal reporter often referred to as the "Fed Whisperer": "I think if you look at the 12-month -- look at the six-month measures, you see very low numbers."
From a data processing perspective, YOY growth data can show the changes in inflation over the past year but are difficult to reflect shorter-term inflation trends. On the other hand, MOM growth data, although rapidly reflecting changes in inflation compared to one month ago, often exhibit significant fluctuations, resulting in considerable noise when used to analyze short-term inflation trends. Annualized six-month growth falls in between, and based on this indicator, we will analyze short-term inflation trends from Powell's perspective.
Data source: Bloomberg, Tiger Brokers
According to our calculations, the annualized six-month growth for October's PCE and core PCE is 2.5% and 2.48%, respectively. Assuming Powell's estimation for November PCE data is correct, the annualized six-month growth rates for November's PCE and core PCE would slip to 1.93% and 1.76%, respectively. This marks the first time since September 2020 that inflation has fallen below the 2% average inflation target! Given this scenario, Powell's statement about considering rate cuts is well-founded.
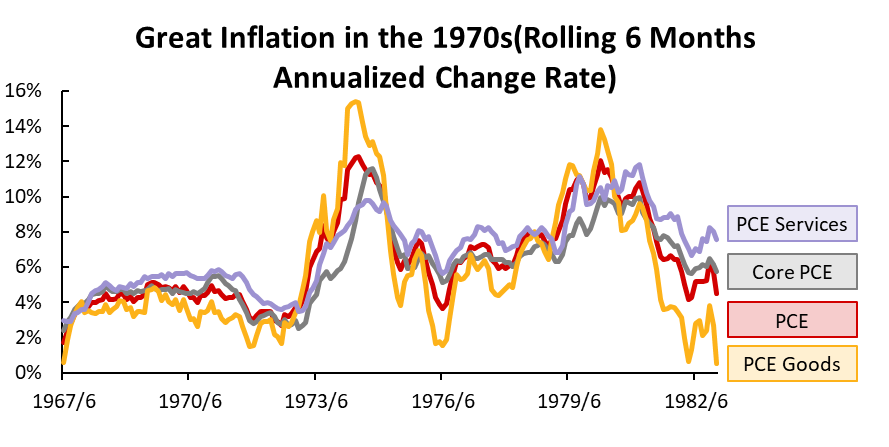
However, Powell is well aware that the temporary return of short-term inflation trends below 2% does not equate to maintaining average inflation around 2%. Therefore, he did not declare victory over inflation prematurely. Looking back to "The Great Inflation", the United States experienced three periods of inflationary pressure between 1965 and 1982. As there are several similarities between the inflationary era of that time and the current macroeconomic environment, the analysis of whether the Fed can successfully control average inflation around 2% still requires exploring the possibility of the second or even the third inflation waves.
Data source: Bloomberg, Tiger Brokers
Breaking down PCE inflation into goods and services, it's evident that the first wave of inflation in the late 1960s was primarily driven by service inflation. In contrast, the subsequent two waves of inflation, initiated in 1973 and 1979, were propelled by goods inflation, with both instances triggered by Middle East oil crises. According to the Atlanta Fed's article "The Great Inflation", the root cause of all three inflation waves was the Federal Reserve's excessive focus on achieving full employment, leading to a delayed response to rising inflation and perpetuating a wage-price spiral.
The current round of inflation, starting in 2021, initially originated from goods inflation due to supply chain issues. Currently, service inflation remains relatively sticky, resembling the later two waves of inflation during the Great Inflation era. However, we should not overlook the high inflation expectations that emerged in the late 1960s, laying the foundation for subsequent episodes of the Great Inflation.

Data source: Bloomberg, Tiger Brokers
Due to a lack of historical data, let's primarily analyze and compare the macroeconomic environments of then and now from a qualitative perspective:
The Great Inflation: 1965 to 1982 | Post-Pandemic Era: 2021 to present | |
Economic Growth |
|
|
Labor Market |
|
|
Fiscal Policy |
|
|
Monetary Policy |
|
|
Geopolitics |
|
|
Data source: Tiger Brokers
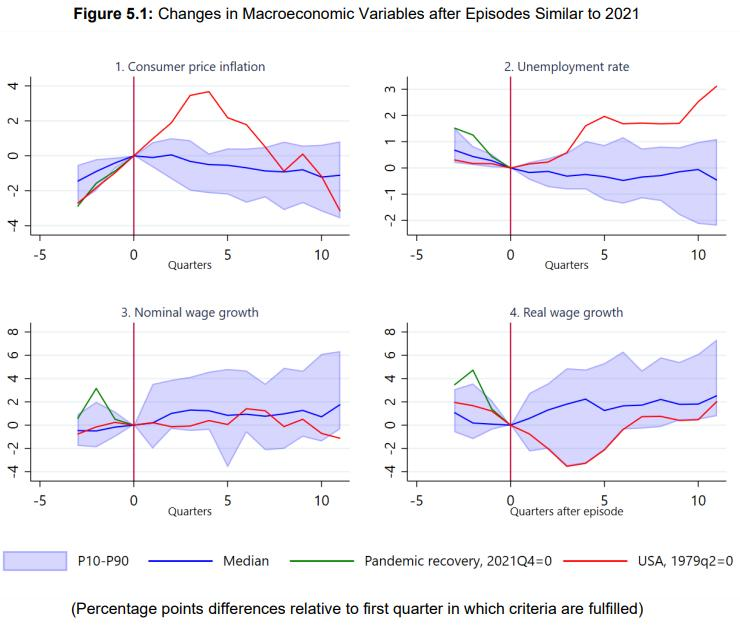
The similarities between the tight job market, stimulative fiscal policy, and ongoing geopolitical conflicts, as seen in the table above, are common points between the Great Inflation and the current macroeconomic environment. These shared factors have the potential to elevate inflation expectations, leading to a wage-price spiral that could sustain high inflation. However, according to a paper published by the IMF at the end of 2022 titled 《Wage-Price Spirals: What is the Historical Evidence?》, during the 79 instances of "wage-price spirals" globally since the 1970s (defined as three out of the past four quarters showing simultaneous increases in CPI and nominal wages), inflation mostly subsided in the following eight quarters. The most significant exception was the second quarter of 1979 in the United States when, due to the resumption of Middle East conflicts, oil prices more than doubled within a year. Then-Fed Chairman Volcker implemented a series of robust anti-inflation measures, ultimately ending the era of Great Inflation at the cost of a severe economic downturn and a substantial increase in unemployment.
Data source:IMF
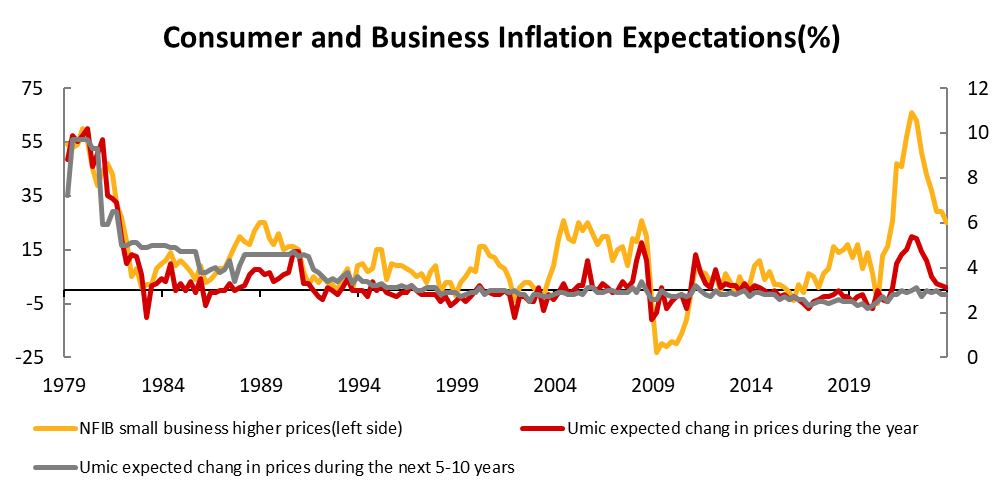
Powell has consistently emphasized over the past year-long tightening cycle that inflation expectations must be anchored, drawing lessons from the Great Inflation. As shown in the chart below, both U.S. consumer inflation expectations and the proportion of small business owners who believe they need to raise prices have sharply declined.
Data source: Bloomberg, Tiger Brokers
Therefore, we believe that, in the absence of external shocks, the Federal Reserve has managed to control the current inflation cycle. However, given the macroeconomic environment currently resembling the Great Inflation era, the reshoring of industries and restructuring of supply chains in the U.S. itself will stimulate inflation expectations. If geopolitical risks bring about commodity inflation once again, the Fed will need to raise interest rates quickly, as it has done in the past year, to prevent an unanchored inflation expectations and achieve its goal of bringing average inflation back to 2%.
2.2 Will The Federal Reserve Really Cut Interest Rates?
Looking at the narrative shift in the Fed's policy throughout the year, it initially focused on "Higher for longer". By July, when the PCE report was released, with YOY growth rates of PCE and core PCE over a six-month period both below 4%, the focus shifted to "Longer." However, with the anticipation of November PCE and core PCE year-on-year growth rates over a six-month period both falling below 2% before the December FOMC meeting, the narrative has completely shifted to "When to cut" and "How low it will be." The core issue the Fed is currently facing is that, in a scenario of declining inflation, real interest rates may become too high, posing potential constraints on economic growth.
Data source: Bloomberg, Tiger Brokers
In the economic projections provided by the Federal Reserve after the December FOMC meeting, the expected real GDP growth rates for the next two years are 1.4% and 1.8%, while PCE inflation is projected to be 2.4% and 2.1%.
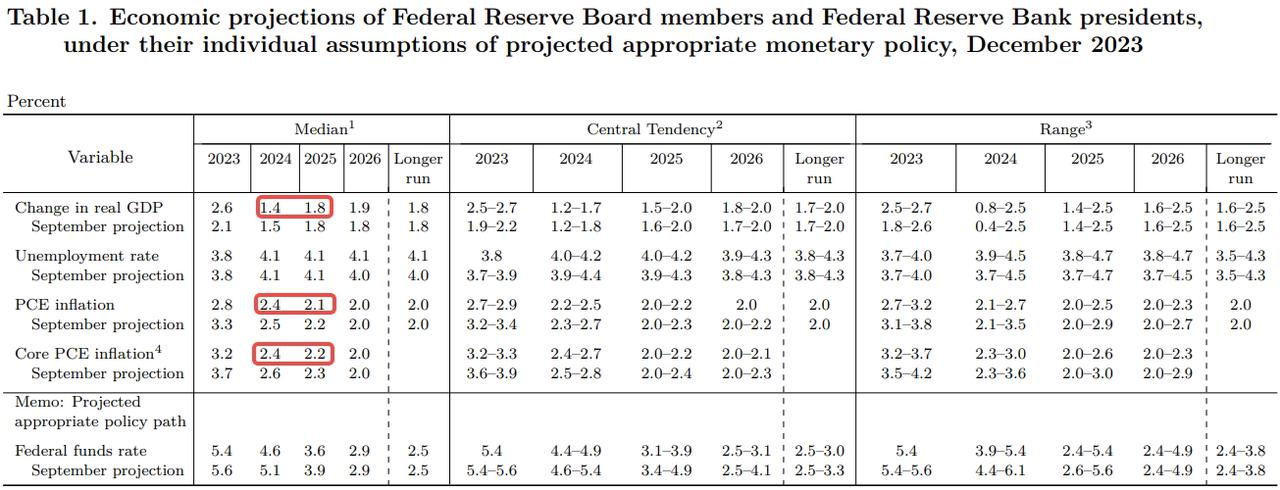
Data source: FED
According to the golden rule of interest rate, under the condition of maximizing consumption, the theoretically real interest rate after should be equal to the real economic growth rate. Former Governor of the People's Bank of China, Yi Gang, pointed out in a paper that if the real interest rate (r) remains consistently higher than the potential economic growth rate (g), it would lead to high corporate financing costs, difficulties in business operations, and would not be conducive to economic growth.
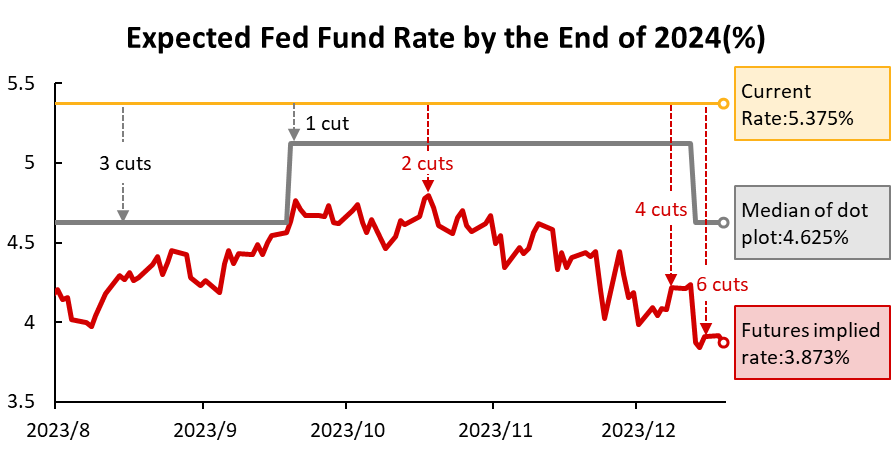
Therefore, assuming that the annualized potential economic growth rate in the United States is around 1.5% in the next two years, and the annualized PCE inflation returns to around 2.25%, the Fed Fund Rate should return to 3.75% within two years.
This is precisely the level after 6-7 rate cuts from the current position. This indicates that the current market is expecting the Fed will adjust policy rates in advance, similar to the rate hikes in 2022.
After all, Chairman Powell turned dovish at the December FOMC meeting, which is quite similar to his complete shift to a hawkish stance at the congressional hearing in late November 2021, abandoning the "transitory inflation" argument.
However, the situation the Federal Reserve faces in 2024 may be quite different from 2022.
In 2022, the outbreak of the Russia-Ukraine war led to extreme shortages on the supply side, driving up commodity inflation. At that time, the policy interest rate was still at 0%, necessitating a significant increase in rates to catch up with the anticipated rise in inflation.
In contrast, the scenario for 2024 could be that the U.S. economy remains resilient, with risks confined to specific sectors. Moreover, Powell has acknowledged that the Fed assumes the inflation rate will decrease from 3% to 2% more slowly than previous declines in inflation. This suggests that the current real interest rate is not far from an appropriate level, eliminating the need for rapid rate cuts to adjust in advance.
At the same time, the historical experience of unanchored inflation expectations during the Great Inflation era serves as a warning for the Federal Reserve. In a macroeconomic environment similar to today's, the Fed is more inclined to follow economic data and slowly lower interest rates as long as there is no sign of soaring inflation expectations.
In summary, we believe that the speed and magnitude of interest rate cuts by the Federal Reserve in 2024 are likely to upset the current market expectations. On the other hand, if there is a supply-side disturbance similar to the Russia-Ukraine war, we would not be surprised the Fed has NO rate cut throughout the year.
Advance vs. Pullback - Can "Big Tech" Continue to Lead the Market?
3.1 Is The Celebration Of Giants A Coincidence Or Necessity?
At the end of 2022, ChatGPT, an AI text chat application, was released and rapidly iterated in the following year, indicating that true AI with universal intelligence is approaching, and people are also looking forward to a new industrial revolution. And this has become the biggest driving force for the performance of US stocks in 2023.
Data source: Bloomberg, Tiger Brokers
As of November, the S&P 500 has risen by 20% year-to-date. More than two-thirds of this increase comes from the seven largest technology giants, despite their combined weight in the index being only a quarter.
These giants are closely associated with the concept of AI, particularly the AI chip company NVIDIA (NVDA), whose stock price has tripled this year! Amid this AI feast, the remaining companies have performed modestly, with over 490 companies contributing to less than one-third of the overall gains.
Data source: Bloomberg, Tiger Brokers
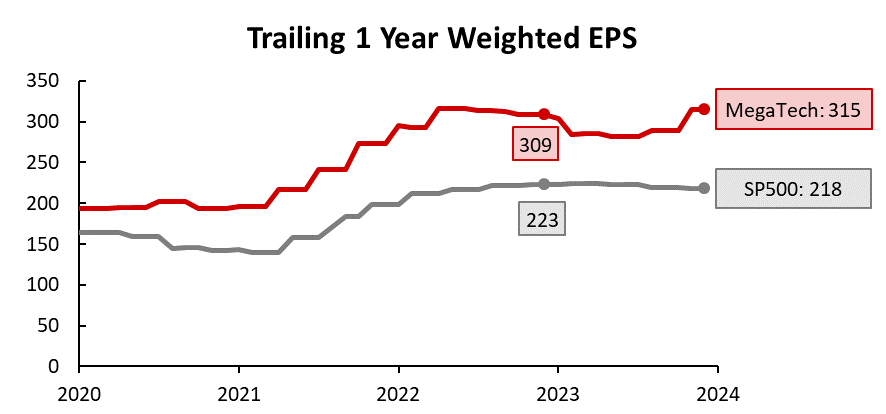
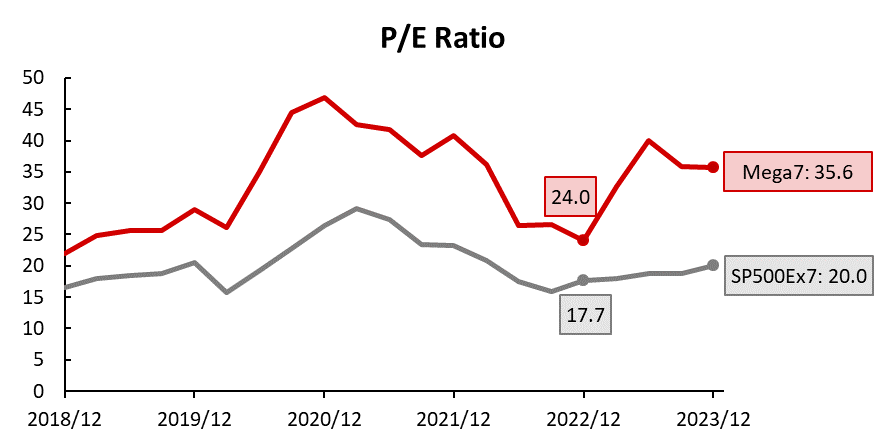
Following the P=PE*EPS formula, we can attribute price movements to valuation and earnings. From the above chart, it's evident that once we exclude the tech giants, the earnings and valuation growth of the S&P 500 are relatively flat.
In contrast, the earnings of MegaTech stocks rebounded strongly after hitting bottom at the beginning of the year and are approaching last year's highs. However, the overall price increase for the year is mainly driven by the rise in PE. The expansion of its valuation is not only due to the momentum in earnings growth but more importantly, the potential profit expectations brought about by the AI technology boom.
Data source: Bloomberg, Tiger Brokers
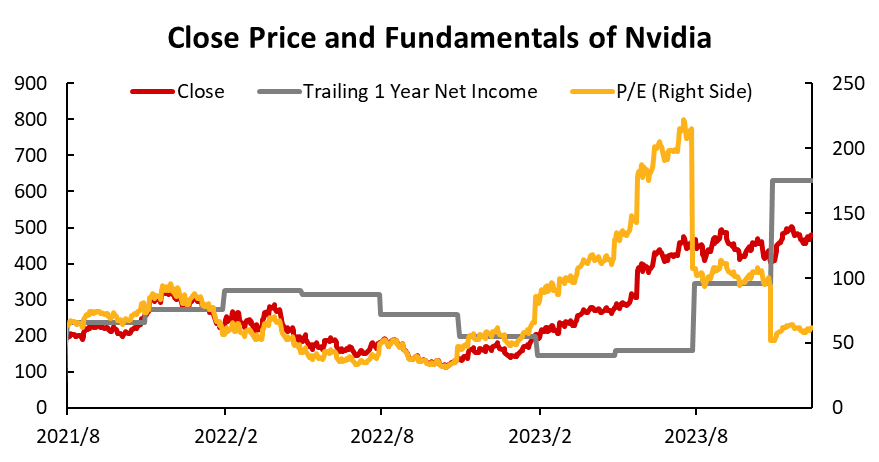
The market's strong expectations for the AI concept are not merely speculative but have already materialized in the financial data of individual stocks. Taking NVIDIA as an example, despite its stock price tripling this year, the explosive growth in revenue from its AI chip business has led to an expansion in profits of a similar magnitude to the stock price increase.
As a result, the current PE has dropped to the level before the release of ChatGPT. Considering analysts' growth expectations for NVIDIA's revenue next year, the Forward P/E is only around 23 times, which is not very high given the significant prospects for AI. It can be said that NVIDIA's current valuation is not solely driven by speculative trading on the concept but is supported by a relatively solid fundamental basis.
In general, looking at the structure of the S&P 500, there is a clear differentiation in stock prices and valuations between the giants and other companies, with their rise driven by the fervor around the AI concept. Therefore, whether the celebration can continue into the next year depends on the future development of AI.
3.2 How Will The AI Feast Unfold?
Giants dancing with AI, supporting the vast sky of the U.S. stock market
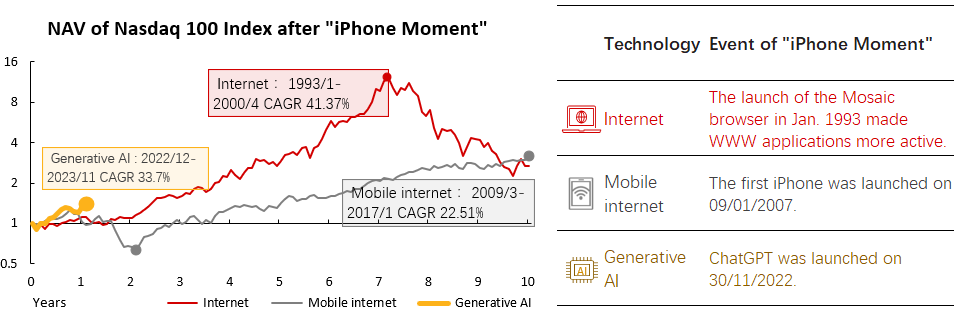
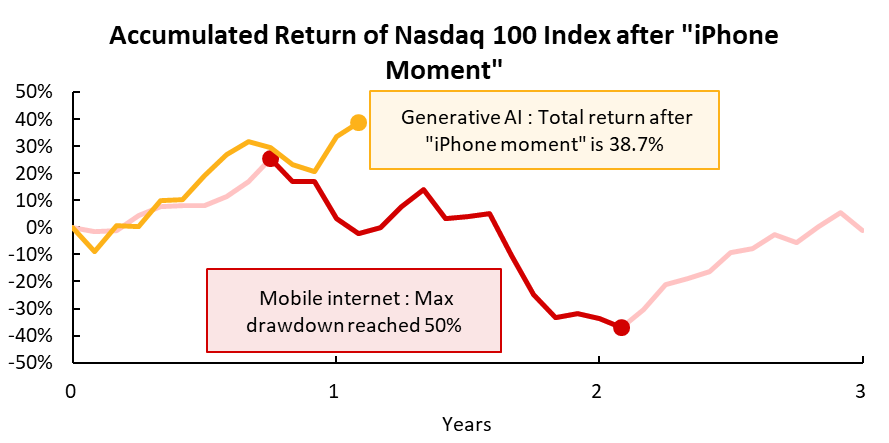
This year, NVIDIA's CEO, Jensen Huang, considered the release of ChatGPT as AI's "iPhone moment." The "iPhone moment" signifies a revolutionary technological breakthrough, and from this point, the technology will experience explosive growth in practical applications, leading human society and economic growth.
Data source: Bloomberg, Tiger Brokers
Reviewing the past "iPhone moments," technology stock indices achieved particularly outstanding growth in the 10 years that followed. During the 1990s Internet boom, up to the peak in April 2000, the Nasdaq 100 index had a CAGR (Compound Annual Growth Rate) exceeding 40%. Although the mobile network suffered a severe blow during the subprime mortgage crisis in its infancy, it led the U.S. stock market out of the longest bull market in history starting from March 2009. Large-cap tech stocks became the main driving force of the stock market, with a CAGR of the index reaching 22.51%.
Based on historical experience, if AI technology can truly change production patterns in the next 10 years, the current growth may just be the beginning.
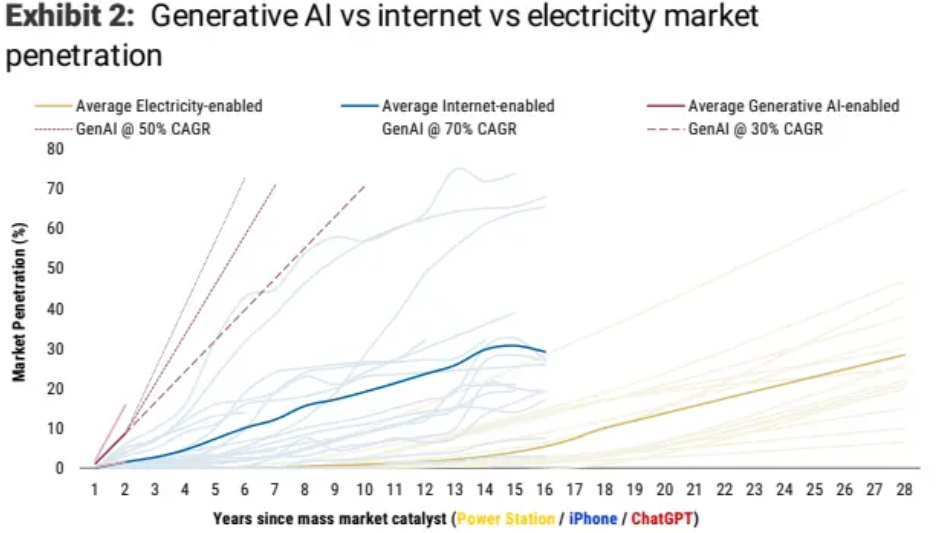
To what extent have AI applications spread now?
Data source: OurWorldinData, Morgan Stanley Research
The chart above estimates the penetration rates of various technologies into different market sectors since the "iPhone moment." It can be observed that ChatGPT has experienced rapid application diffusion within just one year since its release. To achieve a similar level, the Internet took 7 years, while electricity spent 20 years.
Data source: Bloomberg, Tiger Brokers
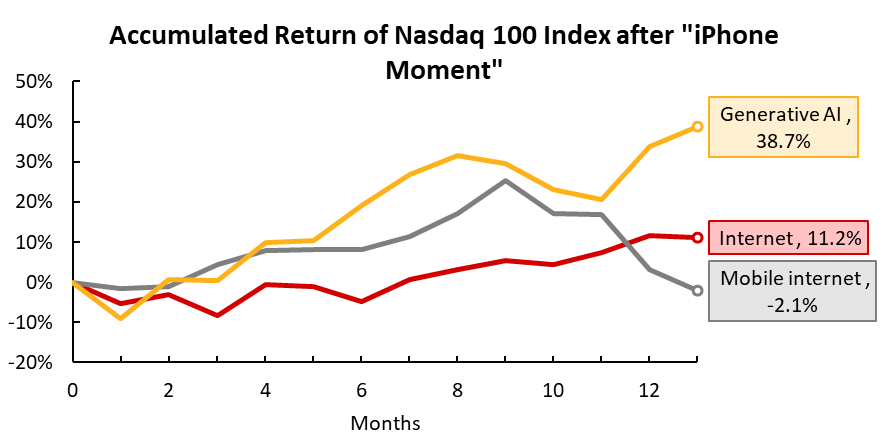
Therefore, it is not difficult to explain why, in the short span of about a year since the release of ChatGPT, even with significant pressure on the stock market due to monetary tightening, the Nasdaq 100 index has still surged by 38.7% as of November. This performance far surpasses the same periods during the Internet and mobile network eras.
Hence, from the perspective of technological breakthroughs and diffusion, the substantial rise driven by the AI concept in this round is understandable. If AI technology continues to iterate to new heights in terms of intelligence, multimodal versatility, and application diffusion, we believe that the long-term excess returns driven by AI are sustainable.
Outlook for 2024: Long-term Growth vs. Short-term Risks
While we are optimistic about the long-term trend of AI, it is also necessary to be cautious about potential risks in the coming year and take timely measures to mitigate them.
Data source: Bloomberg, Tiger Brokers
Just like the release of the first-generation iPhone, which ushered in the era of mobile internet for us, the subsequent subprime mortgage crisis pulled the stock market into turmoil. During this period, the Nasdaq experienced a maximum drawdown of up to 50%. It's worth noting that despite the fervent AI wave this year, the Nasdaq's gain has only been around 40%.
The current market has very high expectations for AI, reflected in elevated valuations for individual stocks. If technological developments fall short of expectations or if these companies are affected by adverse macroeconomic conditions such as recession or stagflation, they are likely to face a "valuation shrink."
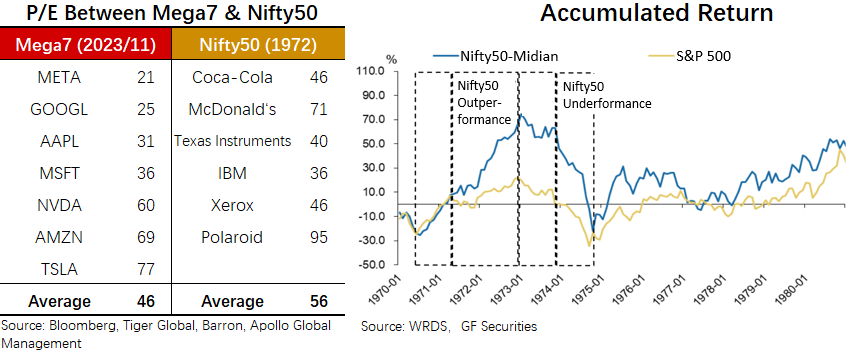
A very similar example in history is the "Nifty 50" in the 1970s, which were all high-quality stocks that the market competed to hype up in the early 1970s, including well-known companies such as Coca Cola, McDonald's, and IBM. After their share prices and valuations went through a crazy rise, they suffered from a series of shocks such as interest rate hikes and energy crises from 1973 to 1974. The valuation bubble burst rapidly, and lost the excess earnings relative to the S&P 500 throughout the 1970s. This indicates that even the best companies will face significant downside risks in the short term. In the process of investing in AI, we also need to consider whether valuations can be quickly digested in the short term.
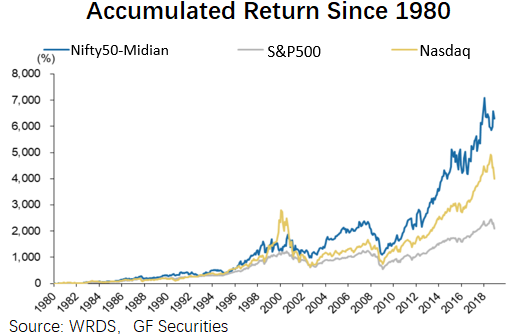
However, as long as the time frame is extended, the "Nifty 50," after a return to rational valuations, performed quite well with solid high-profit growth, showing clear outperformance compared to the S&P and Nasdaq.
At this point, looking back at the significant retracement that occurred in the 1970s, it appears more like a ripple in the face of long-term growth. If this wave of generative AI does bring about a technological revolution, the long-term potential returns are indeed considerable.
In general, AI concept stocks, given their current high expectations and valuations, have logical and fundamental support. From a long-term perspective, as long as a technological revolution truly occurs, a batch of high-quality concept stocks will inevitably emerge.
However, from a short-term perspective, technological development tends to have its ups and downs, and the stock market may face the impact of macroeconomic factors such as recession and stagflation. These shocks can turn high-valuation stocks into significant short-term declines.
Therefore, in the coming year, it is crucial to closely monitor trends in technological changes, be aware of risks in the macroeconomic environment, and take timely hedging and risk-avoidance measures.
Risk vs. Opportunity, How To Invest In Greater China Equities?
4.1 In The Interweaving Of China And The United States, Have Greater China Equities Bottomed Out?
In 2023, while global stock assets generally rose, Hong Kong stocks and Chinese concept stocks moved contrarily, experiencing declines. The duration and magnitude of these drops have been challenging for their holders. The reason lies in these stocks being influenced by both China and the U.S..
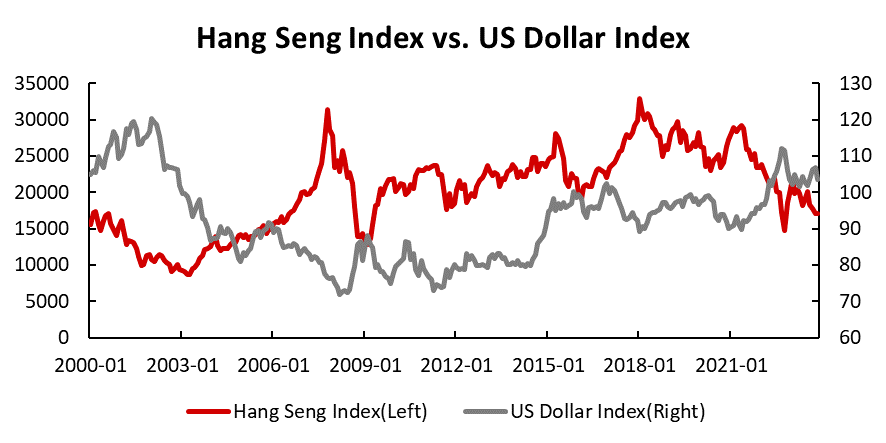
On one hand, U.S. monetary policy directly affects the stock pricing of these companies. We have compared the long-term trends of the Hang Seng Index and the U.S. Dollar Index, finding a significant negative correlation between the two. This year, the Federal Reserve's continuous hawkish stance has directly impacted Hong Kong and Chinese concept stocks negatively, resulting in their sluggish performance
Data source: Bloomberg, Tiger Brokers
As mentioned earlier, although the Federal Reserve has shown a willingness to cut interest rates, substantive rate cuts are still 'pending.' We believe that the market is overly optimistic about the prospect of rate cuts next year, and the actual extent of the cuts may be much less than currently anticipated. In this regard, we analyzed the performance of the Hang Seng Index during the 1 to 6 months prior to the six rate cuts by the Federal Reserve over the past 30-plus years.
Cycle of Cuts | Peak IR Before Cuts | Peak IR Period | 6 months before | 3 months before | 1 months before |
1989/06--1992/09 | 9.75% for 4 months | -10.43% | 3.58% | -8.65% | -11.89% |
1995/07--1996/01 | 6.00% for 5 months | 26.75% | 13.68% | 8.36% | -1.26% |
1998/09--1998/11 | 5.50% for 18 months | -42.24% | -34.88% | -17.58% | -7.70% |
2001/01--2003/06 | 6.50% for 8 months | -1.51% | -5.82% | -3.24% | 7.97% |
2007/09--2008/12 | 5.25% for 15 months | 55.84% | 24.77% | 16.85% | 4.09% |
2019/07--2020/03 | 2.50% for 7 months | 10.14% | 13.05% | 0.42% | 7.10% |
Average: | 6.43% | 2.40% | -0.64% | -0.28% |
Data source: Bloomberg, Tiger Brokers
We discovered that, as shown in the figure above, the Hang Seng Index does not rise in anticipation of rate cuts before they actually occur. Therefore, we believe that it is unlikely for Hong Kong stocks and Chinese concept stocks to benefit from the anticipation of rate cuts next year.
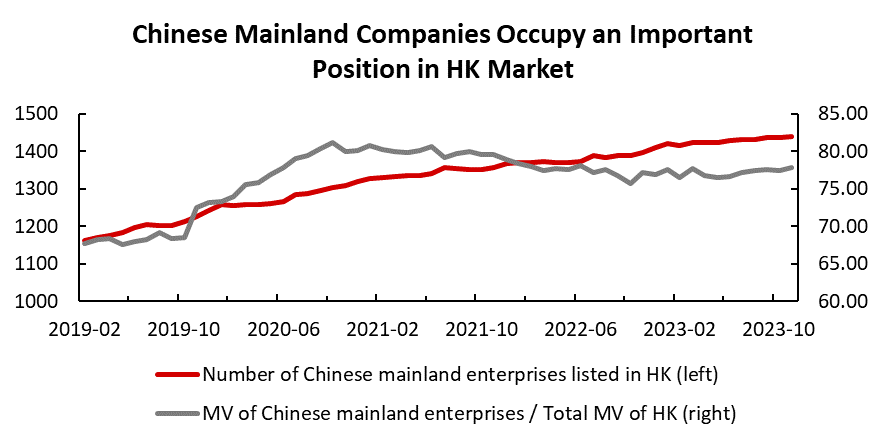
On the other hand, China's economic policies are equally crucial for the operations and profits of companies. In recent years, the number of mainland Chinese companies listed in Hong Kong has been steadily increasing. Even though their market capitalization has somewhat declined, they still represent 75% of the market in terms of scale. Therefore, the economic policies of mainland China directly determine the profitability of these Chinese-funded enterprises and significantly influence the future trend of the Hong Kong stock market.
Data source: WIND, Tiger Brokers
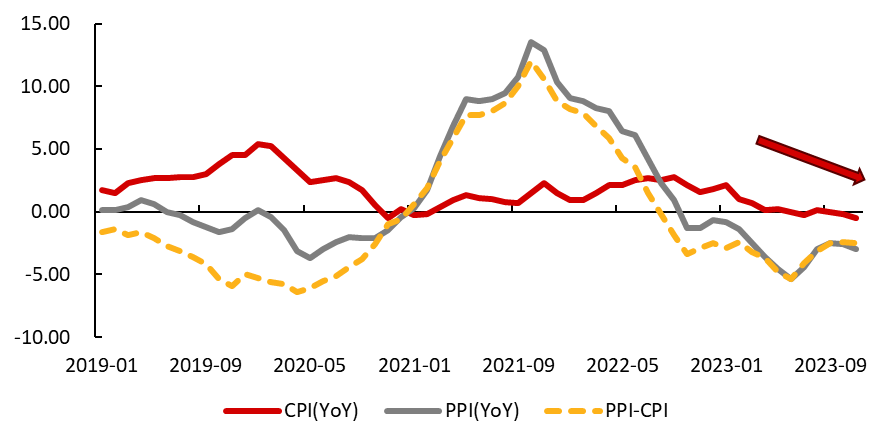
In 2023, the first year following the complete lifting of pandemic restrictions, China's mainland economy experienced a relatively bumpy recovery, with early market expectations of a strong resurgence falling short. Although risks associated with real estate and local government debt have been somewhat alleviated, insufficient effective demand among residents has led to a persistent slump in the Consumer Price Index (CPI). The gap between the Producer Price Index (PPI) and CPI continues to hover below the zero axis, and the shadow of deflation has yet to disperse.
Data source: WIND, Tiger Brokers
Since 2023, both central and local governments in China have introduced and implemented a series of fiscal and monetary stimulus policies. At the Central Economic Work Conference in mid-December, the policy tone for the next year's economy was set: 'Seek progress while maintaining stability, use progress to promote stability, establish before dismantling'"
Guidance for 2024 | Policy Interpretation | |
|---|---|---|
Growth target | "Enhance economic vitality, improve social expectations" |
|
fiscal target | "Moderate exertion, improve quality and efficiency" |
|
Monetary target | "Flexible moderation, precise and effective" |
|
risk prevention | "Continuously and effectively prevent and mitigate risks in key areas" |
|
Data source: Tiger Brokers
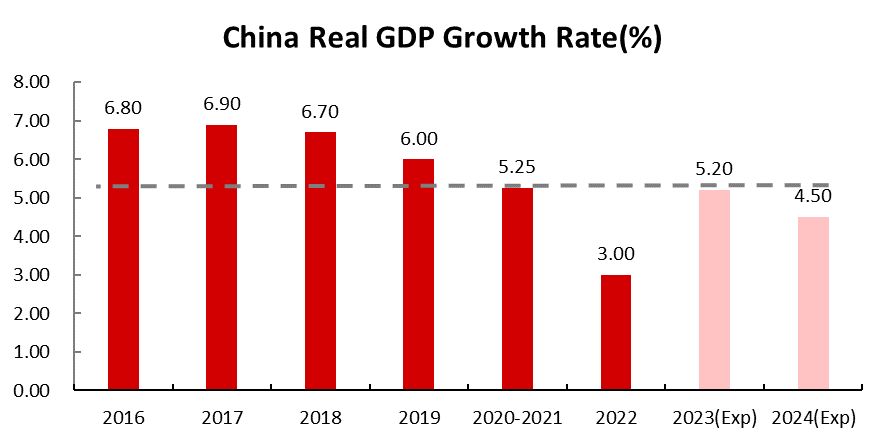
Analyzing analysts' expectations for China's real GDP growth in 2024, the consensus is 4.5%, slightly lower than 2023 and the average of the past few years. Combining this with the set political tone, we believe that China's economy in the coming year will focus more on quality rather than speed. Policy-wise, it will continue to prioritize stability with moderate reinforcement. For Greater China equities, our benchmark expectation is moderate growth for major indices.
Data source: Bloomberg, Tiger Brokers
4.2 Grasping Structural Opportunities Amid Economic Transformation
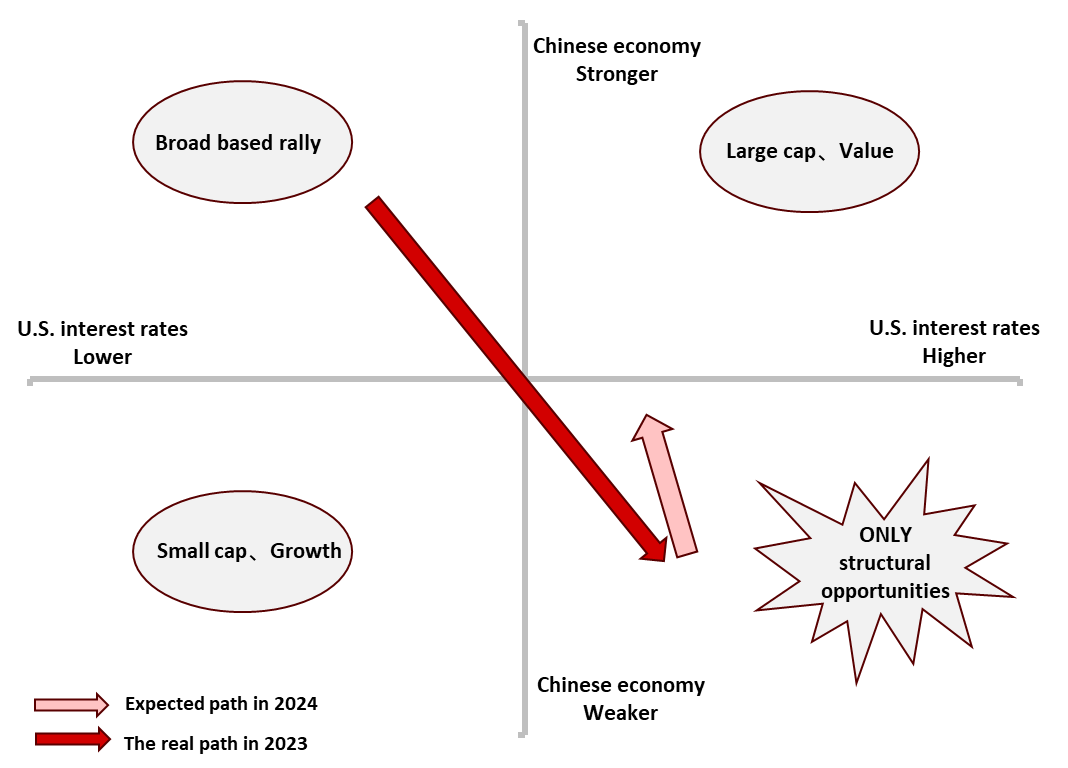
Based on the analysis of U.S. interest rates and the Chinese economy above. We can deduce the expected path for 2024: U.S. interest rates will fluctuate between rate cuts and no rate cuts, and the Chinese economy will continue its slow recovery process from this year.
Therefore, whether from the denominator or the numerator, it may be challenging for Hong Kong stocks and Chinese concept stocks to experience a broad-based bull market next year. However, there are still opportunities to grasp in specific sectors or themes.
Data source: Tiger Brokers
To grasp the structural opportunities in Greater China equities, one must first deeply understand what is happening in Chinese society at present. In 2023, the first year after the Zero-Covid policy, Chinese people are returning to the streets. Although there hasn't been a surge in retaliatory consumption, some interesting social phenomena have emerged:
Phenomenon 1 |
|
Phenomenon 2 |
|
Phenomenon 3 |
|
Phenomenon 4 |
|
Phenomenon 5 |
|
Phenomenon 6 |
|
... | |
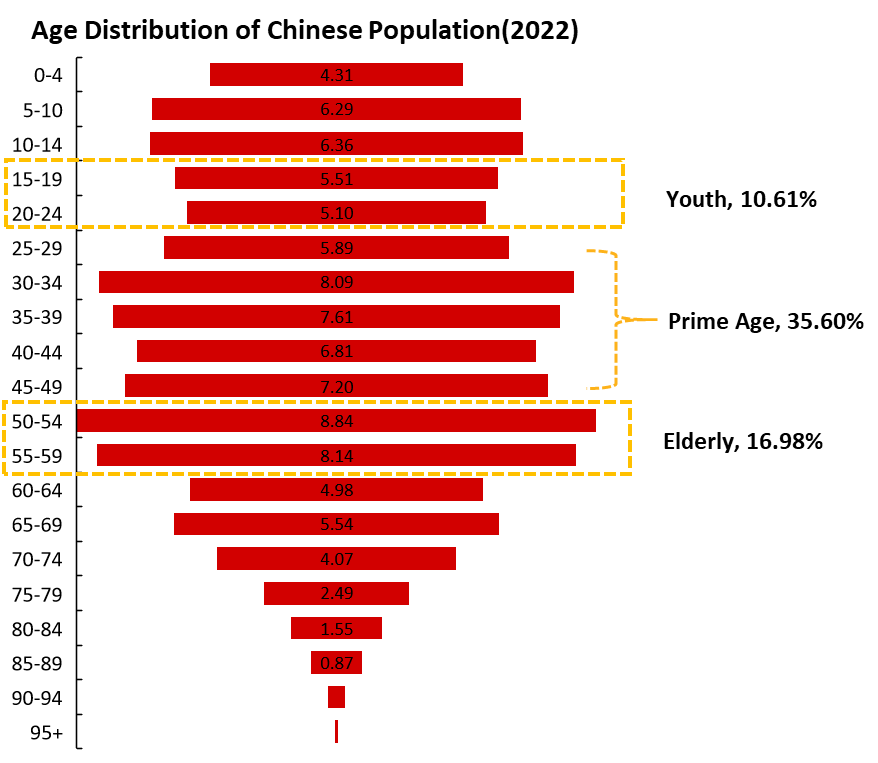
These seemingly absurd yet strangely reasonable phenomena all point to a common issue: demographic structure. In most cases, the population distribution of individuals aged 15 to 59 is crucial. They not only contribute the majority of tax revenue but also constitute the main force of social consumption, to some extent determining the future direction of industries and investment opportunities. According to the data from Bureau of Statistics of China in 2022, the 15-59 age demographic group accounts for over 60% of the population and serves as the backbone of society. When subdivided, it includes three groups: youth, prime age, and elderly.
Data source: Bureau of Statistics of China, Tiger Brokers
Prime Age: 25 to 49 years old, accounting for about 35%. The typical profile of this group is married with liabilities such as mortgage payments, supporting elderly parents, and raising children. Considering the current high household debt levels and the inevitable pains of deleveraging, we believe it may be challenging to find sustained structural opportunities for this mainstream demographic.
Youth: 15 to 25 years old, accounting for only about 10%. The typical profile of this group includes students or young professionals who have just entered the workforce. In June 2023, the DT Research Institute conducted a survey on the income and savings status of young people in first and second-tier cities, revealing that over 20% of young people have savings of less than 10,000 yuan! Considering the varying economic development among regions, if expanded to the entire country, this amount would likely be even lower. At the same time, events like concerts that appeal to young people are sold out, and popular restaurants and attractions are crowded. This suggests that young people prefer to have fun in a timely manner, enjoy self-pleasing consumption, and high cost effective consumption.
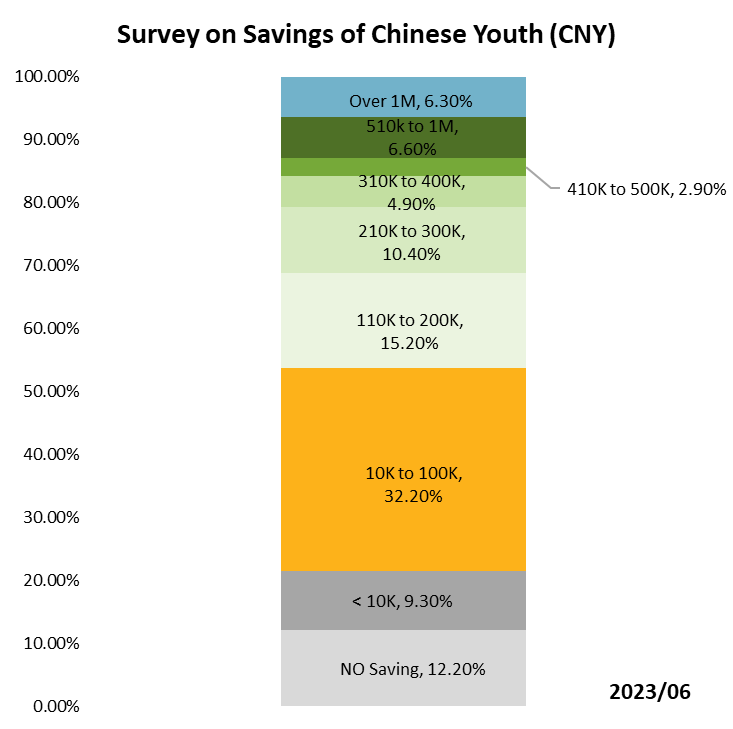
Data source: 2023 Young People's Savings Research Report by DT Research Institute, compiled by Tiger Brokers.
Elderly individuals, aged 50 to 59, account for nearly 17%, a significantly higher proportion than the youth demographic. The typical profile of this group includes individuals who are either approaching retirement or have already retired, with grown children and minimal debt pressures. From an income perspective, this demographic has benefited from the "reform and opening-up" wave in China, coinciding with the property boom of the past two decades, resulting in relatively abundant assets and stable savings. In terms of consumption, according to PwC's 2017 White Paper on Consumer Habits among the Elderly in China, 60% of the elderly prioritize "product quality" over "cost effective." Additionally, expenditures on travel, social activities, and healthcare constitute around 30% of the elderly's total spending. Therefore, the elderly population have savings to spend, time to spend and are willing to spend. Significant opportunities arise especially in addressing seniors' social and healthcare needs.
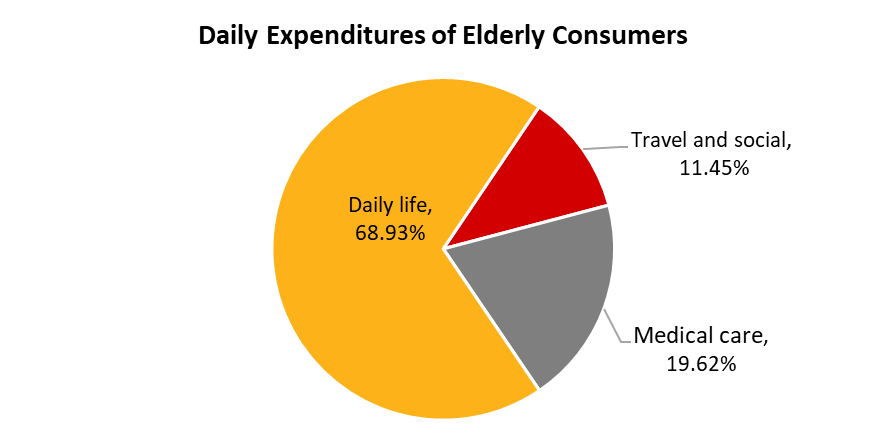
Data source: 2017 China Elderly Consumer Habits by PwC, compiled by Tiger Brokers.
In summary, we believe that in 2024, the trend of aging population in China will continue, and the income structure and consumption habits of both the youth and the elderly are unlikely to undergo significant changes. Therefore, regarding the consumption demands of these two major demographic groups, there are several sectors and themes in Greater China equities that are worth special attention:
Reasons | ||
|---|---|---|
Online Entertainment |
|
|
High Cost-Performance Consumption |
|
|
Elderly Care and Medical Services |
|
|
Data source: Tiger Brokers
3. Major Asset Outlook in 2024
1. U.S. Equities: Stay Vigilant, Prepared For Unexpected
Outlook for U.S. Equities:
Current State of U.S. Equities: The current overall trend of U.S. equities market is that Mega 7, which has a high quality, high profit expectation, enjoying high valuations, while small-cap stocks, which are more affected by high interest rates, still maintain relatively low valuations. We anticipate that in the "soft landing" or "no landing" scenario, high-quality stocks are likely to continue leading the market. However, for small-cap stocks, a substantial round of refinancing is expected in the coming years, and the part of their rise based on the expectation of rapid Fed rate cuts may not be sustainable. There may not be much room for valuation recovery.
AI Concept as a Long-Term Investment: The AI concept remains a very promising long-term investment theme and is worth continuous allocation. However, investors should be cautious about the risks associated with economic downturns and AI technology reaching bottlenecks, and they should be prepared to hedge or take defensive measures. Additionally, in the rapidly evolving technological landscape, old industry leaders are at risk of being replaced, as illustrated by the case of Google, which was once a dominant force in AI. As technology diffuses, AI will gradually penetrate a broader range of research and application-oriented companies, benefiting not only a few but several companies. Therefore, it is advisable to avoid overly concentrating investments in a single company, and diversified investment across sectors or timely rotation of leading companies following industry trends is a better choice.
Difficulty in Replicating This Year's Huge Gains: The major U.S. stock indices are overall unlikely to replicate the enormous gains seen this year. On the opportunity side, AI technology has made a breakthrough from 0 to 1 in general intelligent applications this year, presenting an explosive fundamental positive that is hard to come by. On the risk side, whether it's a local blow-up event in a high-interest-rate environment or a market correction of fast Fed rate cuts, both could trigger a sharp index pullback. Historically, the volatility of U.S. stocks in election years is significantly higher than in other years. However, based on our expectation of that the resiliant the U.S. economy and a low "hard landing" probability, we believe that the overall U.S. equities market will experience downside surprises without major risks.
2. Greater China Equities: Focus on Structural Opportunities, Not Major Indices
Outlook for Greater China Equities:
The pricing of Hong Kong stocks and Chinese concept stocks is similar, influenced by both U.S. interest rates and stimulus from the Chinese economy. We believe that next year the Fed's stance will turn dovish, but the market rate cuts expectations are too aggressive. Meanwhile, the Chinese economy will continue to prioritize stability, focusing on risk mitigation and emphasizing quality over quantity. Therefore, it's challenging for Hong Kong stocks and Chinese concept stocks to experience a broad-based bull market.
With the long-term trend of an aging population in China, combined with the current consumption habits of young people and the distribution of wealth, we believe that more attention can be paid to the "self pleasing" consumption of young people and the "elderly care" consumption of the elderly for Hong Kong and Chinese concept stocks,.
In particular, focus on sectors and themes such as online entertainment, cost-effective consumption, high-end elderly care, and healthcare to seize structural investment opportunities.
3. U.S. Treasuries: Enjoy High Yields On The Short End, Swing Trading On the Long End
Outlook for U.S. Treasuries:
In the short term, the narrative of the Fed pivot is favorable for further downward movement in the overall yield curve. Combined with potential credit events in certain areas in a high-interest-rate environment, the 10-year Treasury yield is expected to further explore the range of 3.25% to 3.5%, corresponding to a scenario of mild economic downturn in the United States.
However, if overall economic data in the United States remains robust or external geopolitical conflicts trigger an increase in inflation expectations, the market is likely to correct the expectations of impending interest rate cuts, leading to a rebound in the 10-year Treasury yield. If we calculate based on the long-term potential economic growth rate of 2% and long-term inflation expectations of 2% in the United States, the central tendency of the 10-year Treasury bond yield should be around 4%.
Major institutions are expecting a decrease total issuance of U.S. Treasuries next year compared to this year. However, the issuance of notes and bonds will far exceed this year's levels. Combined with the possibility of the Bank of Japan ultimately abandoning Yield Curve Control (YCC), this may drive a liquidation of global carry trades. We anticipate that the long-term interest rates in the United States may rebound to above 4.5% after this round of decline, and the inverted yield curve is expected to be rectified during this process.
The high-interest-rate era in the United States is not likely to end next year. Using the 10-year Treasury yield as a reference, it is feasible to strategically buy more long-term bonds in the upper end of the interest rate range and gradually switch to short-term bonds in the lower end of interest rate range to continue enjoying the high yields.
4. Outlook for Other Assets
Outlook for Other Assets
We believe that the investment risk reward of gold in 2024 is moderate, yet it still holds value as a safe haven and recession-resistant allocation. Last year, we anticipated gold to be a core asset to allocate in 2023, supported by factors such as the sustained expansion of the U.S. fiscal deficit and the ongoing global trend of moving away from U.S. dollar assets amid escalating geopolitical conflicts. Additionally, the U.S. economy, nearing recession in a high-interest-rate environment, exhibited greater downward potential in real interest rates than upward. As we enter 2024, despite the continued geopolitical tensions and the still high U.S. fiscal deficit, on the one hand, breakthroughs in generative AI are likely to boost the long-term growth rate of the U.S. economy. On the other hand, the speed of nominal interest rate decline is likely to mirror the pace of inflation downturn, keeping real interest rates elevated. The COMEX gold would need a further loosening of the U.S. dollar dominance to effectively surpass its historical high of $2152.3.
In the baseline scenario, we expect bulk commodities to continue their oscillating downward trend. On the demand side, there is no fundamental basis for major bulk commodities to experience a price increase, as fiscal stimulus in various countries are difficult to expand, and even the United States, with the best economic situation, will face a slowdown in growth. On the supply side, periodic geopolitical conflicts are expected to persist, causing temporary shortages in the supply of certain commodities. However, as long as there are no major geopolitical events on the scale of the Russia-Ukraine war, major bulk commodities are expected to see only pulse-like upward movements, which are challenging to sustain for an extended period.
We anticipate that taking a long position on the Japanese yen will be a trade with relatively high certainty in 2024. Japan's CPI has remained above 3% for over a year since August of last year, and current inflation is becoming more widespread, with subcategories such as food, housing, clothing, and entertainment experiencing inflation at levels not seen since 1995. At the same time, Japanese Prime Minister Fumio Kishida has identified raising wages as a core task in the concept of "new capitalism" to expand income distribution policies, driving Japanese companies to undergo the largest pay raise in nearly 30 years. Moreover, the real GDP YOY growth rate has exceeded 1% for two consecutive years, sustaining both the economy and inflation at relatively high levels, a phenomenon not seen in Japan over the past 30 years. Under these circumstances, the normalization of interest rates by the Bank of Japan is only a matter of time, and the yen has a relatively certain appreciation potential supported by these expectations.
Disclaimer: Investing carries risk. This is not financial advice and should not be regarded as a solicitation or recommendation of acquiring or disposing of financial products. Past performance is no guarantee of future results. Graphics and charts are for illustrative purposes only. You should consider the appropriateness of any information having regard to your individual objectives, financial situation or needs.